The ATL Office 100 Law Firm Rankings (2016)
Welcome to the 2016
ATL Office 100 Law Firm Rankings,
presented by Kinney Recruiting.
Not all law firm offices are created equal, even within the same firm. However, most rankings compare law firms nationally or solely within specific regions. The ATL Office 100 aims to address this knowledge gap by comparing law firm offices across 10 major markets. This additional information provides insights into which firm offices are more desirable (Should I work in Skadden’s New York or Chicago office?) and which firms have the strongest presence in specific regions (Should I move to Boston for that position with WilmerHale? Or would I be better off with Latham here in New York?).
Lots of people rank law firms. And you can dice up law firm rankings in so many ways: by “prestige,” revenues, and more. That’s all great, but if you are going to work in a Biglaw firm, you are going to be working in a specific office. And that office is going to make or break your experience with your firm. Not all offices are created equal, even within the same firm. There are firms that aren’t thought of very highly overall, but a specific office of their operation might be doing great work and be the place for your kind of thing.
With these rankings, Above the Law is trying to capture the strength and relevance of major law firms in today's market. Who are the market leaders? Which firms are still making and retaining their partners? Where do you want to work? But the methods for evaluating the large law firms that are best at the business of practicing law are stuck in the past. The new normal means new challenges for firms. Is bigger always better? More revenue sounds nice, unless the firm is overly reliant on a few rainmakers who can jump ship and leave the rest of the firm scrambling for clients. Surely, the last client who cared about white-shoe status is somewhere trying to find a new ribbon for his typewriter.
The Office 100 blends objective data points (changes in headcount over time, promotional prospects, and number of women partners) with subjective feedback from over 20,000 associates, partners, and other members of the legal community. The result is a more complete picture of each individual office, encompassing employee satisfaction, compensation, reputation, desirability as an employer, and data-driven measures of firm growth. The Office 100 is meant to offer a new perspective on some of the most prestigious and wealthy firms by using a new rubric to show how they stack up both against their competitors and across their own offices.
The ATL Office 100 Law Firm Rankings
| Rank | 2015 Rank | Firm | Office | Score |
|---|---|---|---|---|
| 1 | 1 | Kirkland & Ellis LLP | Chicago | 85.00 |
| 2 | 11 | Latham & Watkins LLP | Los Angeles | 84.87 |
| 3 | 6 | Davis Polk & Wardwell | New York | 84.62 |
| 4 | 22 | Vinson & Elkins LLP | Houston | 83.78 |
| 5 | 13 (tie) | Sidley Austin LLP | Chicago | 83.39 |
| 6 | 9 | Gibson Dunn & Crutcher LLP | Los Angeles | 81.95 |
| 7 | 5 | Alston & Bird LLP | Atlanta | 81.42 |
| 8 | 18 | King & Spalding | Atlanta | 81.26 |
| 9 | 24 | Latham & Watkins LLP | Chicago | 81.17 |
| 10 | 13 (tie) | Sullivan & Cromwell LLP | New York | 80.58 |
| 11 | Jones Day | Cleveland | 80.38 | |
| 12 | 15 | Simpson Thacher & Bartlett LLP | New York | 80.28 |
| 13 | 12 | Covington & Burling LLP | Washington, DC | 79.89 |
| 14 | 20 | Skadden, Arps, Slate, Meagher & Flom LLP and Affiliates | Chicago | 79.75 |
| 15 | 8 | Cravath, Swaine & Moore LLP | New York | 79.66 |
| 16 | 36 | Latham & Watkins LLP | Houston | 79.45 |
| 17 | Greenberg Traurig, LLP | Miami | 79.22 | |
| 18 | 29 | Paul, Weiss, Rifkind, Wharton & Garrison LLP | New York | 79.09 |
| 19 | 27 | Kirkland & Ellis LLP | Washington, DC | 78.67 |
| 20 | 17 | Cleary Gottlieb Steen & Hamilton LLP | New York | 78.66 |
| 21 | 30 | Skadden, Arps, Slate, Meagher & Flom LLP and Affiliates | Los Angeles | 78.62 |
| 22 | 7 | Munger, Tolles & Olson LLP | Los Angeles | 78.14 |
| 23 | 28 | Davis Polk & Wardwell | Silicon Valley | 78.11 |
| 24 | 40 (tie) | Cooley LLP | Silicon Valley | 77.53 |
| 25 | 25 | Skadden, Arps, Slate, Meagher & Flom LLP and Affiliates | New York | 77.33 |
| 26 | 42 | Latham & Watkins LLP | Silicon Valley | 77.31 |
| 27 | 26 | WilmerHale | Washington, DC | 77.17 |
| 28 | 2 | Wachtell, Lipton, Rosen & Katz | New York | 77.14 |
| 29 | 4 | Morgan Lewis & Bockius LLP | Philadelphia | 77.08 |
| 30 | 47 | Boies, Schiller & Flexner LLP | New York | 76.81 |
| 31 | 39 | Quinn Emanuel Urquhart & Sullivan LLP | Los Angeles | 76.53 |
| 32 | 31 | Gibson Dunn & Crutcher LLP | San Francisco | 76.28 |
| 33 | 10 | Kirkland & Ellis LLP | San Francisco | 76.03 |
| 34 | 16 | WilmerHale | Boston | 75.80 |
| 35 | 63 | Quinn Emanuel Urquhart & Sullivan LLP | San Francisco | 75.77 |
| 36 | K&L Gates LLP | Pittsburgh | 75.69 | |
| 37 | 19 | Gibson Dunn & Crutcher LLP | Washington, DC | 75.62 |
| 38 | 40 (tie) | Debevoise & Plimpton LLP | New York | 75.27 |
| 39 | 34 | Kirkland & Ellis LLP | Los Angeles | 75.25 |
| 40 | 45 | Williams & Connolly LLP | Washington, DC | 75.09 |
| 41 | 52 | Sidley Austin LLP | Washington, DC | 74.93 |
| 42 | 77 | Mayer Brown LLP | Chicago | 74.53 |
| 43 | Kirkland & Ellis | New York | 74.20 | |
| 44 | 37 | Paul, Weiss, Rifkind, Wharton & Garrison LLP | Washington, DC | 74.20 |
| 45 | Gibson Dunn & Crutcher LLP | Dallas | 74.14 | |
| 46 | 76 | Skadden, Arps, Slate, Meagher & Flom LLP and Affiliates | Silicon Valley | 74.11 |
| 47 | 3 | Ropes & Gray LLP | Boston | 74.09 |
| 48 | 38 | Latham & Watkins LLP | San Francisco | 74.08 |
| 49 | 33 | Kilpatrick Townsend & Stockton LLP | Atlanta | 74.00 |
| 50 | Reed Smith LLP | Pittsburgh | 73.96 | |
| 51 | Jones Day | Pittsburgh | 73.89 | |
| 52 | 54 | Latham & Watkins LLP | New York | 73.65 |
| 52 | Baker & Hostetler LLP | Cleveland | 73.65 | |
| 53 | 23 | Skadden, Arps, Slate, Meagher & Flom LLP and Affiliates | Washington, DC | 73.42 |
| 54 | 56 | Covington & Burling LLP | San Francisco | 73.41 |
| 54 | 57 | Jones Day | Chicago | 73.41 |
| 55 | 35 | O'Melveny & Myers LLP | Los Angeles | 73.35 |
| 56 | 32 | Wilson Sonsini Goodrich & Rosati | Silicon Valley | 73.34 |
| 57 | 51 | Weil, Gotshal & Manges LLP | New York | 73.32 |
| 58 | 55 | Cleary Gottlieb Steen & Hamilton LLP | Washington, DC | 72.90 |
| 59 | 82 | Jenner & Block LLP | Chicago | 72.79 |
| 60 | 49 | Irell & Manella LLP | Los Angeles | 72.57 |
| 61 | 68 | Quinn Emanuel Urquhart & Sullivan LLP | Washington, DC | 72.31 |
| 62 | 78 | Baker & Hostetler LLP | Philadelphia | 72.30 |
| 63 | 21 | Dechert LLP | Philadelphia | 72.00 |
| 64 | 48 | Wilson Sonsini Goodrich & Rosati | San Francisco | 71.84 |
| 65 | 85 | McDermott Will & Emery LLP | Chicago | 71.67 |
| 66 | 58 | Goodwin Procter LLP | Boston | 71.54 |
| 67 | Vinson & Elkins LLP | Dallas | 71.34 | |
| 68 | 83 | Sidley Austin LLP | Los Angeles | 71.26 |
| 69 | Baker Botts LLP | Dallas | 71.00 | |
| 70 | 61 | Gibson Dunn & Crutcher LLP | New York | 70.97 |
| 71 | 59 | Jones Day | Washington, DC | 70.82 |
| 72 | 75 | Gibson Dunn & Crutcher LLP | Silicon Valley | 70.71 |
| 73 | 81 | Simpson Thacher & Bartlett LLP | Silicon Valley | 70.58 |
| 74 | 95 | Weil, Gotshal & Manges LLP | Silicon Valley | 70.56 |
| 75 | 60 | Arnold & Porter LLP | Washington, DC | 70.38 |
| 76 | 44 | Latham & Watkins LLP | Washington, DC | 70.22 |
| 77 | 88 | Cooley LLP | San Francisco | 70.18 |
| 77 | 53 | Morrison & Foerster LLP | San Francisco | 70.18 |
| 78 | 69 | Morrison & Foerster LLP | Silicon Valley | 70.13 |
| 79 | 70 | Baker Botts LLP | Houston | 70.11 |
| 80 | 80 | Paul Hastings LLP | Los Angeles | 70.09 |
| 81 | 67 | Orrick, Herrington & Sutcliffe LLP | San Francisco | 70.00 |
| 82 | 64 | Quinn Emanuel Urquhart & Sullivan LLP | New York | 69.75 |
| 83 | Sidley Austin LLP | Dallas | 69.34 | |
| 84 | 66 | Hogan Lovells US LLP | Washington, DC | 69.28 |
| 85 | Orrick, Herrington & Sutcliffe LLP | Silicon Valley | 69.05 | |
| 86 | Paul Hastings LLP | Washington, DC | 68.85 | |
| 87 | 72 | Susman Godfrey L.L.P. | Houston | 68.79 |
| 88 | Milbank, Tweed, Hadley & McCloy LLP | New York | 68.78 | |
| 89 | 74 | Weil, Gotshal & Manges LLP | Washington, DC | 68.63 |
| 90 | Fenwick & West LLP | Silicon Valley | 68.50 | |
| 91 | Winston & Strawn LLP | Chicago | 68.42 | |
| 92 | 62 | Jones Day | Atlanta | 68.11 |
| 93 | 91 | Cahill Gordon & Reindel LLP | New York | 67.61 |
| 94 | O'Melveny & Myers LLP | Washington, DC | 67.54 | |
| 95 | 43 | Skadden, Arps, Slate, Meagher & Flom LLP and Affiliates | Boston | 67.41 |
| 96 | Jones Day | Dallas | 67.38 | |
| 97 | 79 | Morrison & Foerster LLP | Los Angeles | 66.98 |
| 98 | Keker & Van Nest LLP | San Francisco | 66.91 | |
| 98 | 86 | Fish & Richardson | Boston | 66.91 |
| 99 | White & Case | Miami | 66.84 | |
| 100 | 71 | Sidley Austin LLP | San Francisco | 66.74 |
Methodology
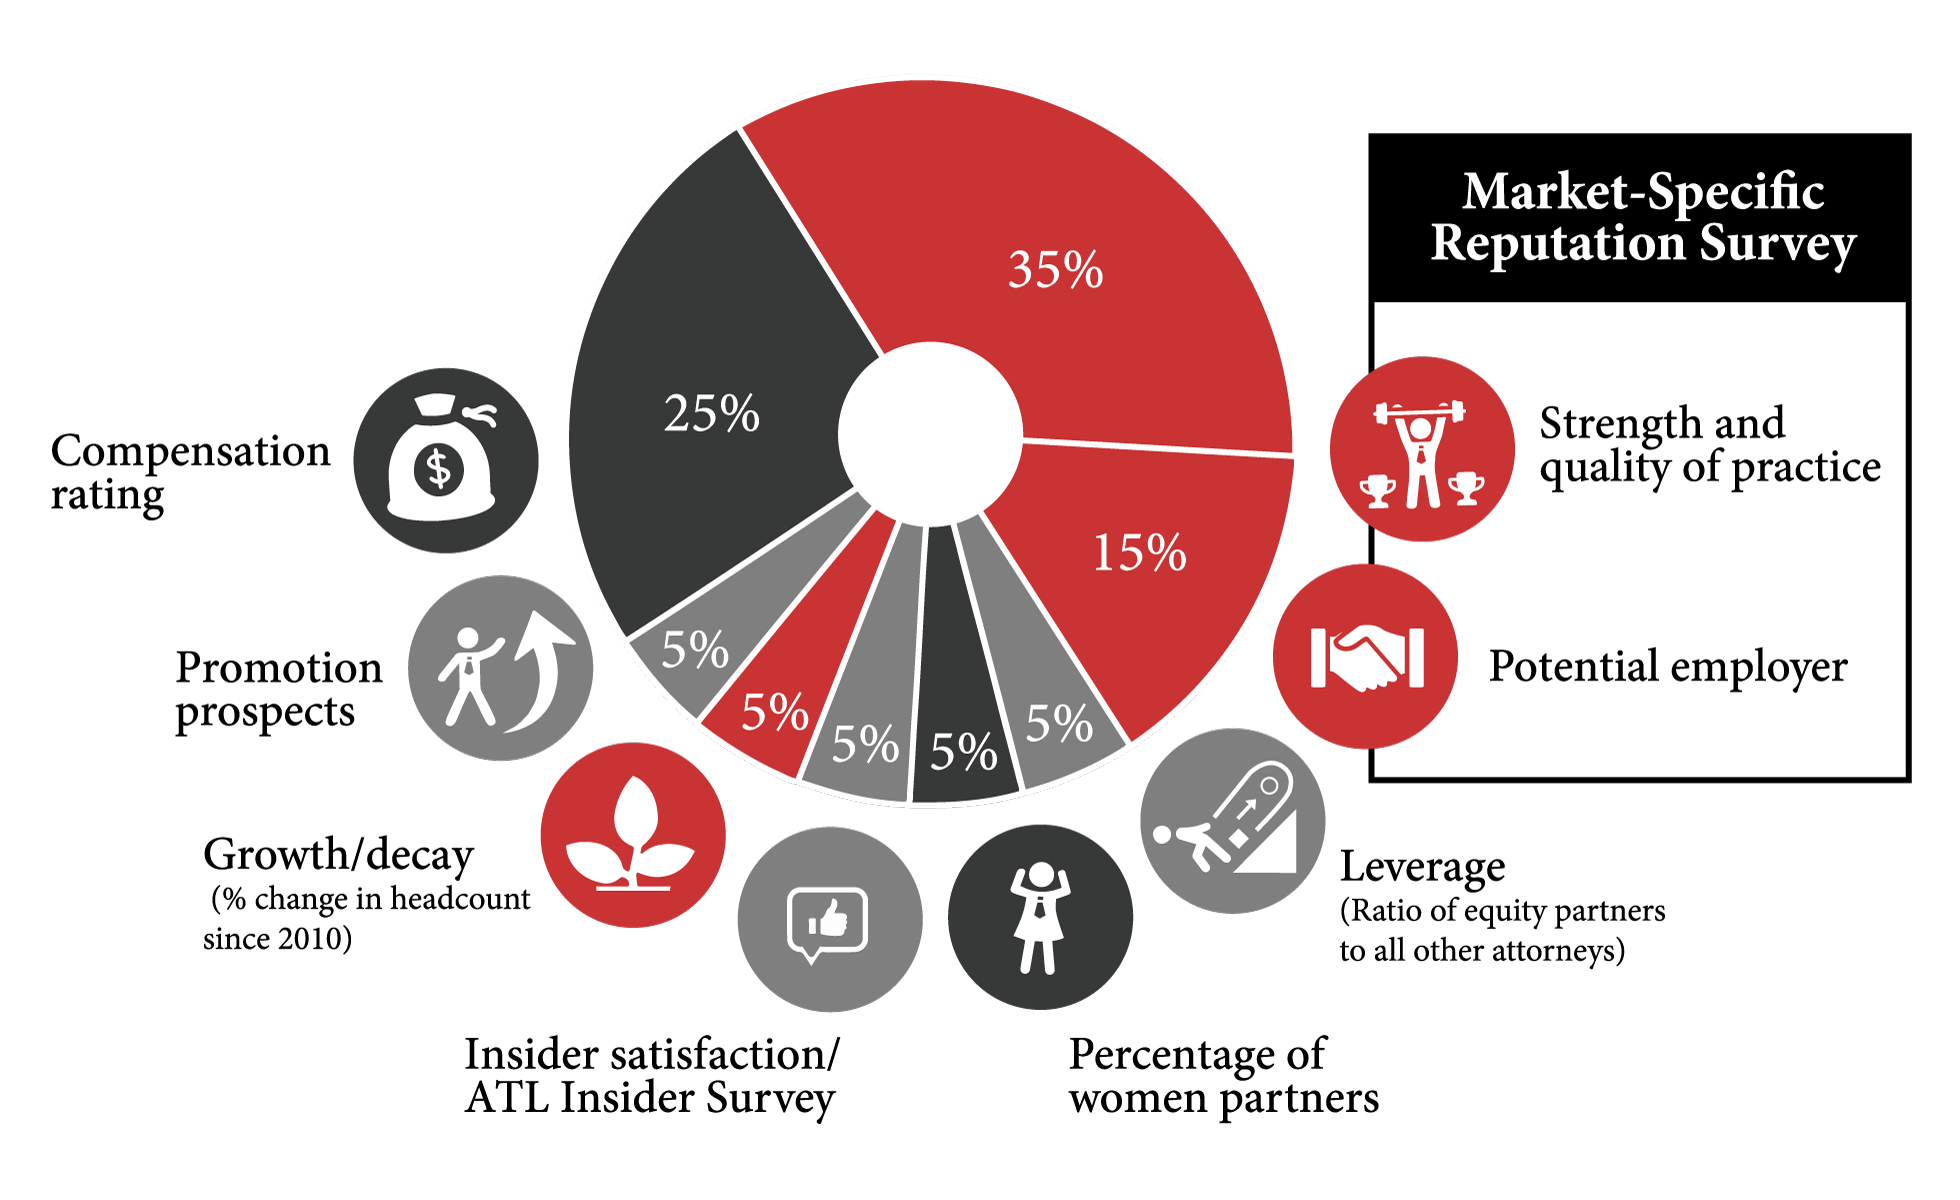
Over the summer, we conducted the ATL Law Firm Reputation Survey, asking those of you working in Biglaw to rate your peers and competitors. Included in these rankings were market-specific questions, inquiring about both the reputation of firms in each survey participant's city as well as each firm's desirability as a potential employer. In creating the survey, we limited our city-specific firm choices to offices with at least 50 lawyers. Our office rankings include the following markets: Atlanta, Boston, Chicago, Houston, Los Angeles, New York, Philadelphia, San Francisco, Silicon Valley and Washington, DC.
Firms are rated on a scale with 100 possible points:
- Market-specific reputation survey*
“Strength and quality of practice”: 35%
“Potential employer”: 15% - Leverage
Ratio of equity partners to all other attorneys: 5% - Growth/decay
% change in headcount since 2010: 5% - Percentage of women partners: 5%
- Partnership prospects
% of all non-partners who made partner in the most recent promotion cycle: 5%** -
Insider satisfaction
ATL Insider Survey: 5% - Compensation rating: 25%***
Clearly, we are making value judgments in choosing and assigning weight to these metrics. For example, we are rewarding firms for maintaining low leverage, or for offering a relatively better chance for incoming associates to eventually ascend to partnership.
Also, to be sure, law firms are not homogenous in their approaches to partnership tracks or compensation structures or other aspects that we have sought to measure here, but we have done our best to account for these differences and create a formula that allows for meaningful comparisons.
The perfect "ATL score" is 100. Each firm is awarded a maximum number of points based on the weight of each metric (a maximum of 25 points for highest compensation rating, 5 points for highest growth headcount, etc.). The points are awarded on a sliding scale from highest to lowest. (For certain categories, firms were placed into tiers and points were apportioned accordingly.) Those points add up to the total ATL score seen on the rankings table.
* We limited our city-specific firm choices to offices with at least 50 lawyers. Survey conducted in partnership with Kinney Recruiting.
** Promotion data courtesy of NavForward.
*** Compensation rating accounts for the following 4 factors: first-year salary, recent track record for bonuses, profits per partner (as reported to Am Law), and survey data.